Summary statistics on BENGI GM12878 benchmarks
library(corrplot)
library(ggplot2)
Data importation
rm(list = ls())

nb_benchmarks <- 6
# Personal
path_to_benchmarks <- "/home/hoellinger/Documents/INSERM/BENGI/Benchmark/All-Pairs.Natural-Ratio/"
# Inserm path_to_benchmarks <-
# '/home/thoellinger/Documents/BENGI/Benchmark/All-Pairs.Natural-Ratio/'

# All pairs, fixed ratio, GM12878 ben1 <- 'GM12878.CHiC-Benchmark.v4.new.bedpe'
# ben2 <- 'GM12878.CTCF-ChIAPET-Benchmark.v4.new.bedpe' ben3 <-
# 'GM12878.GEUVADIS-Benchmark.v4.new.bedpe' ben4 <-
# 'GM12878.GTEx-Benchmark.v4.new.bedpe' ben5 <-
# 'GM12878.HiC-Benchmark.v4.new.bedpe' ben6 <-
# 'GM12878.RNAPII-ChIAPET-Benchmark.v4.new.bedpe' names <- c('CHiC', 'CTCF',
# 'GEUVADIS', 'GTEx', 'HiC', 'RNAPII') All pairs, natural ratio, GM12878
ben1 <- "GM12878.CHiC-Benchmark.v3.new.bedpe"
ben2 <- "GM12878.CTCF-ChIAPET-Benchmark.v3.new.bedpe"
ben3 <- "GM12878.GEUVADIS-Benchmark.v3.new.bedpe"
ben4 <- "GM12878.GTEx-Benchmark.v3.new.bedpe"
ben5 <- "GM12878.HiC-Benchmark.v3.new.bedpe"
ben6 <- "GM12878.RNAPII-ChIAPET-Benchmark.v3.new.bedpe"
names <- c("CHiC", "CTCF", "GEUVADIS", "GTEx", "HiC", "RNAPII")

list_of_files <- list(paste(path_to_benchmarks, ben1, sep = ""), paste(path_to_benchmarks,
    ben2, sep = ""), paste(path_to_benchmarks, ben3, sep = ""), paste(path_to_benchmarks,
    ben4, sep = ""), paste(path_to_benchmarks, ben5, sep = ""), paste(path_to_benchmarks,
    ben6, sep = ""))

col_names <- c("chrom1", "start1", "end1", "chrom2", "start2", "end2", "name", "interaction",
    "strand1", "strand2", "TSSs")
to_factor_benchmarks <- c(1, 4, 7, 8, 9, 10)

benchmarks = lapply(list_of_files, function(file) {
    as.data.frame(read.table(file, sep = "\t"))
})
benchmarks = sapply(benchmarks, simplify = FALSE, function(Df) {
    Df[to_factor_benchmarks] = lapply(Df[to_factor_benchmarks], factor)
    names(Df) <- col_names
    return(Df)
})
names(benchmarks) <- names
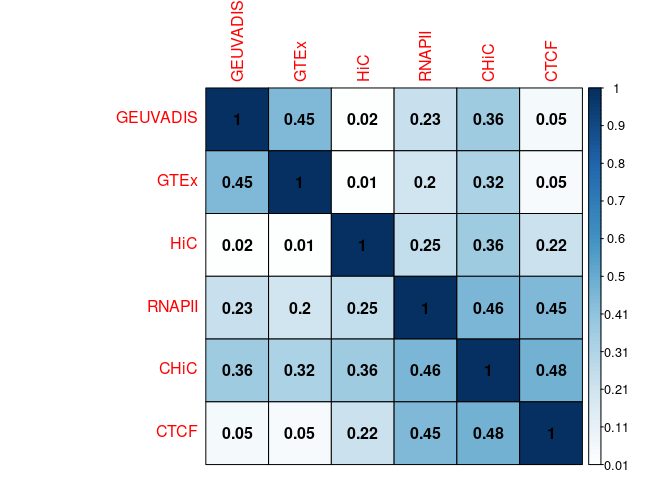
Overlap coefficient
positives <- list(nb_benchmarks)
positives <- sapply(benchmarks, simplify = FALSE, function(Df) {
    return(Df$interaction == "1")
})
nb_positives <- vector(length = nb_benchmarks)
for (i in 1:nb_benchmarks) {
    nb_positives[i] <- sum(positives[[i]])
}

length_benchmarks <- vector(length = nb_benchmarks)  #seems it is not really useful
for (i in 1:nb_benchmarks) {
    length_benchmarks[i] <- nrow(benchmarks[[i]])
}

Overlap <- as.matrix(diag(nb_benchmarks))
rownames(Overlap) <- names
colnames(Overlap) <- names

if (nb_benchmarks > 1) {
    for (i in 2:nb_benchmarks) {
        for (j in 1:(i - 1)) {
            Overlap[i, j] = length(intersect(benchmarks[[i]][positives[[i]], 7],
                benchmarks[[j]][positives[[j]], 7]))/min(nb_positives[i], nb_positives[j])
        }
    }
    Overlap[upper.tri(Overlap)] <- t(Overlap)[upper.tri(Overlap)]
}

# png(file='/home/hoellinger/Documents/INSERM/shared/notes_perso/docs/moore2020/expA_all_pairs_fixed_ratio.png',
# width=700, height=700)
corrplot(Overlap, method = "color", type = "full", is.corr = FALSE, diag = TRUE,
    outline = TRUE, addCoef.col = "black", addCoefasPercent = FALSE, order = "hclust",
    hclust.method = "ward.D2")
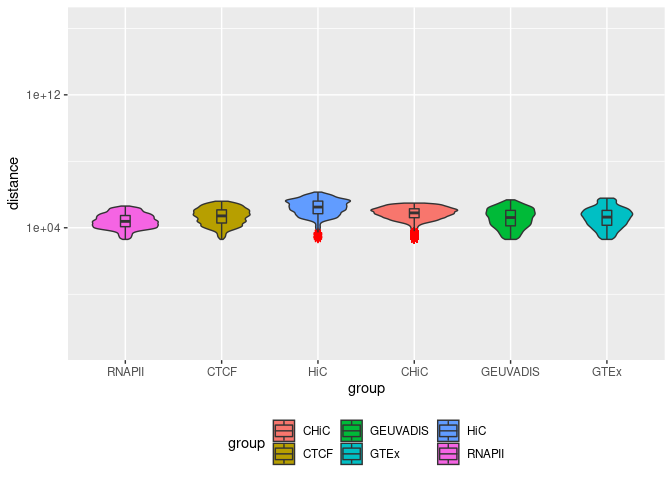
Distance distribution
benchmarks <- sapply(benchmarks, simplify = FALSE, USE.NAMES = TRUE, function(Df) {
    Df[[11]] <- sapply(Df[[11]], simplify = FALSE, USE.NAMES = TRUE, function(x) {
        x <- as.numeric(strsplit(x, ",")[[1]])
        return(x)
    })
    return(Df)
})

# min of min distance
benchmarks <- sapply(benchmarks, simplify = FALSE, USE.NAMES = TRUE, function(Df) {
    Df$distance <- mapply(function(x, y, z) min(min(abs(x - y)), min(abs(x - z))),
        Df[[11]], Df[[5]], Df[[6]])
    return(Df)
})

# Distances of positives + negatives Distances <- list() for(k in
# 1:nb_benchmarks){ Distances[[k]] <-
# data.frame(matrix(unlist(benchmarks[[k]]$distance), nrow=length_benchmarks[k],
# byrow=T), rep(names[k], length_benchmarks[k])) names(Distances[[k]]) <-
# c('distance', 'group') Distances[[k]]$group <- as.factor(Distances[[k]]$group)
# }

# Distances of positives
Distances <- list()
for (k in 1:nb_benchmarks) {
    Distances[[k]] <- data.frame(matrix(unlist(benchmarks[[k]]$distance[positives[[k]]]),
        nrow = nb_positives[k], byrow = T), rep(names[k], nb_positives[k]))
    names(Distances[[k]]) <- c("distance", "group")
    Distances[[k]]$group <- as.factor(Distances[[k]]$group)
}

Df_distances <- rbind(Distances[[1]], Distances[[2]], Distances[[3]], Distances[[4]],
    Distances[[5]], Distances[[6]])  # should find a way to do this without having to manually write each element of the list

quantiles <- list()
for (k in 1:nb_benchmarks) {
    quantiles[k] <- quantile(Distances[[k]]$distance, 0.95)
}

summary(Df_distances)

    distance            group
 Min.   :   2002   CHiC    :88245
 1st Qu.:  29068   CTCF    : 7591
 Median :  64854   GEUVADIS: 2073
 Mean   :  90392   GTEx    : 1301
 3rd Qu.: 127085   HiC     : 3404
 Max.   :1402098   RNAPII  :23699

print("0.95-quantiles:")

[1] "0.95-quantiles:"

print(names)

[1] "CHiC"     "CTCF"     "GEUVADIS" "GTEx"     "HiC"      "RNAPII"

t(quantiles)

     [,1]     [,2]   [,3]   [,4]   [,5]     [,6]
[1,] 245524.8 277808 282008 435494 890210.4 137229.7

# png(file='/home/hoellinger/Documents/INSERM/shared/notes_perso/docs/moore2020/distancesV1.png',
# width=700, height=700)
# png(file='/home/thoellinger/Documents/shared/notes_perso/docs/moore2020/distances_with_negatives_min_min.png',
# width=700, height=700) limits=c(1e-3,2e16)
ggplot(Df_distances, aes(x = group, y = distance, fill = group)) + geom_violin() +
    scale_y_continuous(trans = "log10", limits = c(0.001, 2e+16), n.breaks = 3) +
    geom_boxplot(width = 0.1, outlier.colour = "red", outlier.shape = 8) + theme(legend.position = "bottom") +
    scale_x_discrete(limits = c(names[6], names[2], names[5], names[1], names[3],
        names[4]))