Pairwise chromatin accessibility correlation across cell types
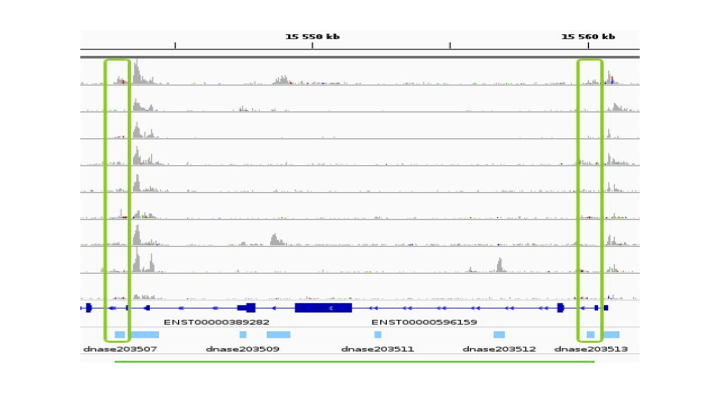
The simplest heuristic enhancer/gene identification method is to compute the the pairwise chromatin accessibility correlation. We represent here on the following figure:
Here are the actions that led to this figure: we first downloaded the ENCODE uniformly processed read alignments (bam files) of DNAse-seq data (single end) from 10 cell types:
stomach ENCFF703DYP
HepG2 ENCFF343CEI
K562 ENCFF224FMI
thymus ENCFF067LVL
adrenal gland ENCFF900LLD
small intestine ENCFF315TUQ
GM12878 ENCFF246VVI
IMR-90 ENCFF775ZJX
heart ENCFF923SKV
H1-hESC ENCFF869SQU
These 10 bam files could easily be downloaded from the data search part of the ENCODE web site.
We then called the chromatin accessibility peaks from the mapped reads in each cell type using macs2 version 2.1.1.20160309 and the following command:
macs2 callpeak --nomodel -f BAM -t $celltype.bam -n $celltype \
--keep-dup all --verbose 3 2> macs2.err > macs2.out
We obtained from about 60,000 (GM12878) to about 200,000 (IMR-90) peaks per cell type. By concatenating, sorting and merging on the genome the peaks called in each cell type using bedtools merge version 2.29, we then obtained 473,766 consensus peaks across all cell types. We then quantified the chromatin accessibility of the 473,766 consensus peaks in each cell type by simply counting the number of mapped reads of each cell type overlapping each consensus peak using bedtools intersect version 2.29, and normalized the number of reads of each peak in each cell type by the total number of mapped reads in peaks for this cell type. Finally we computed the consensus peak pairwise Pearson correlation between the log10 of the normalized chromatin accessibility across the 10 cell types of these peaks for all pairs of peaks less distant than 500kb using the script compute_correlations.py available in our github repository. We then only considered as E/G relationships the pairs of peaks with a correlation above 0.7 and for which one of the two peaks overlapped the most 5' bp (TSS) of a Gencode v19} gene (vertical green rectangles on the figure above).