Guidelines to run DNase-expression correlation method over BENGI benchmarks
Prerequisites
First we need to download the curated DNase counts from http://big.databio.org/papers/RED/supplement/ (see p. 14 of the BENGI paper).
Correlation-Methods/
└── Sheffield
    └── Signal-Matrices
        ├── dhs112_v3_int.bed
        ├── dhs112_v3_int.bed.gz
        └── exp112.bed
Partial reimplementation of Run-Sheffield.sh
First we make a copy of the Scripts folder downloaded from BENGI Github. We name it local_Scripts.
$ tree -L 2
.
├── Benchmark
│   ├── All-Pairs.Fixed-Ratio
│   ├── All-Pairs.Natural-Ratio
│   ├── Annotations
│   ├── README.md
│   ├── Remove-Ambiguous-Pairs.Fixed-Ratio
│   └── Remove-Ambiguous-Pairs.Natural-Ratio
├── Correlation-Methods
│   └── Sheffield
├── Distance-Method
│   └── Results
├── local_Scripts
│   ├── Generate-Benchmark
│   ├── Supervised-Methods
│   └── Unsupervised-Methods
├── README.md
└── Scripts
    ├── Generate-Benchmark
    ├── Supervised-Methods
    └── Unsupervised-Methods
Now we replace the content of local_Scripts/Unsupervised-Methods/Run-Sheffield.sh with the following:
#!/bin/bash

#################
## DEPENDENCIES #
#################
# bedtools
# python2
# scipy

#################
## INPUT ARGS: ##
#################
# $1: `data`. Name of BENGI benchmark. Example: "GM12878.CHiC"
# $2: `version`. Example: "v3" for BENGI with All pairs, Natural ratio
# $3: `intermediate_output` relative_path to parent folder for intermediate results.
#                           Folder need not exist yet.

# WARNING: some inputs are not passed as args, see code below!

#################
#### OUTPUT #####
#################
# els.bed: input `data` are intersected with ccREs that are involved in the BENGI
#          benchmarks. These ccREs are a subset of the ccREs with enhancer-like
#          signature for the cell type considered (+ they are distal - >2kb - from
#          any ENCODE-annotated TSS). After that, result is sorted and uniqued.
# enhancer-matrix.bed
# genes
# genesFull

# Inserm computer
#workDir=~/Documents
# Personal computer
#workDir=~/Documents/INSERM
# Genotoul
workDir=/work2/project/regenet/workspace/thoellinger

ccres=$workDir/BENGI/Benchmark/Annotations/hg19-cCREs.bed
gnid_gname=/work2/project/regenet/workspace/thoellinger/BENGI/homo_sapiens.gnid.gnname.tsv

# One must create the following repository before launching the script:
signalDir=$workDir/BENGI/Correlation-Methods/Sheffield/
featureDir=$signalDir/Signal-Matrices # must contain DNase counts and gene expression
#                                       "dhs112_v3_int.bed", "exp112.bed"
# see (http://big.databio.org/papers/RED/supplement/)

data=$1
version=$2
intermediate_outputs_dir=$3 # All output that are not final results are
#                         going to be stored here. Need not exist before launching the
#                         script

intermediate_outputs=$intermediate_outputs_dir/$data
genes=$intermediate_outputs/genes # need not exist yet
genesFull=$intermediate_outputs/genesFull # need not exist yet
els=$intermediate_outputs/els.bed # need not exist yet
enhancer_matrix=$intermediate_outputs/enhancer-matrix.txt # need not exist yet

biosample=$(echo $data | awk -F "." '{print $1}')
echo $biosample

setDir=$workDir/BENGI/Benchmark/All-Pairs.Natural-Ratio
train=$setDir/$data-Benchmark.$version.txt

scriptDir=$workDir/BENGI/local_Scripts/Unsupervised-Methods # we modified the scripts found on BENGI Github
outputDir=$signalDir/Results

mkdir -p $outputDir
mkdir -p $intermediate_outputs

# dhs112_v3_int.bed (http://big.databio.org/papers/RED/supplement/) is space-delimited
# so we first replace spaces by tabs. It contains the DNase counts over whole genome
# for 112 cell types.
# exp112.bed: idem. It contains the gene expressions for 112 cell types.

if [[ ! -f $els ]]; then
       echo "Finding ccRE-dELS in input data..."
       awk 'FNR==NR {x[$1];next} ($5 in x)'  $train $ccres | awk '{print $1 "\t" \
           $2 "\t" $3 "\t" $5}' | sort -u > $els
fi

# WARNING: NOT ONLY THIS TASK MUST OBVIOUSLY BE RUN AT LEAST ON A NODE
# BUT WE NEED TO ALLOCATE ENOUGH MEMORY TO PREVENT IT FROM BEING KILLED

if [[ ! -f $featureDir/dhs112_v3_int_tab.bed ]]; then
       echo "dhs112 => dhs112_tab..."
       awk 'BEGIN{} {n=split($0, line, " "); ORS="\n"; print line[0]; ORS="\t"; for(u=1; u<n; u++){print line[u]}; ORS=""; print line[n]}' $featureDir/dhs112_v3_int.bed > $featureDir/dhs112_v3_int_tab.bed
fi

if [[ ! -f $enhancer_matrix ]]; then
       echo "Building enhancer matrix (DNase counts for all the input cell types) using bedtools... This can take several minutes..."
       bedtools intersect -wo -a $els -b $featureDir/dhs112_v3_int_tab.bed > $enhancer_matrix
fi
# enhancer-matrix.txt contains:
# $1 to $4: enhancer infos, bed format
# $5 to $7: for the current enhancer, chr, start and end of an overlapping DHS.
# $8 to $(n_columns-1): respective DNase counts for all the 112
#                         cell types encountered in dhs112_v3_int_tab.bed
# $n_columns: length (in bp) of the overlap

if [[ ! -f $genes ]]; then
       echo "Finding all genes in input..."
       cat $train | awk '{print $2}' | sort -u  > $genes
fi

if [[ ! -f $genesFull ]]; then
       echo "Computing gene list (<id> <name>)..."
       awk 'FNR==NR {x[$1];next} ($1 in x)' $genes $gnid_gname > $genesFull # warning: the python code has to be changed. See markdown.
fi

# we replaced `$stats` by NOTHING as we do not use this argument.
if [[ ! -f $featureDir/exp112_tab.bed ]]; then
       echo "Adapting expression file format..."
       awk '{n=split($0, line, " "); ORS="\n"; if(NR==1){ORS=""}; print line[0]; ORS="\t"; for(u=1; u<n; u++){print line[u]}; ORS=""; print line[n]}' $featureDir/exp112.bed > $featureDir/exp112_tab.bed
fi

echo "Running python script... This can take several minutes..."
python $scriptDir/sheffield.correlation.py $featureDir/exp112_tab.bed $genesFull $enhancer_matrix NOTHING $train $biosample |sort -t $'\t' -k 5,6 > $outputDir/$data-Correlation.$version.txt
Partial reimplementation of sheffield.correlation.py
We replace the content of local_Scripts/Unsupervised-Methods/sheffield.correlation.py with the following (do not pay too much attention to comments, some of them may be inaccurate):
#!/usr/bin/python
# -*- coding: utf-8 -*-

import sys, scipy, math
from scipy import stats

import numpy as np # to reconstruct statDict "by hand"

from itertools import groupby
# We use all_equal to prevent a division-by-zero error in Calculate_Correlation
def all_equal(iterable):
       g = groupby(iterable)
       return next(g, True) and not next(g, False)

def Process_Biosample(biosample):
  biosampleDict={"GM12878":28, "HeLa":50, "K562":88,"HMEC":59,"NHEK":100}
  if biosample in biosampleDict:
      return biosampleDict[biosample]
  else:
      return "no"

def Calculate_Correlation(array1, array2):
           if not (all_equal(array1) or all_equal(array2)):
          stat=stats.pearsonr(array1, array2)[0]
           else:
                   stat = float('NaN')
  return stat

def Create_Gene_Dict(genes):
  geneDict={}
  genes.next() #skips header
  for line in genes:
      line=line.rstrip().split("\t")
      geneDict[line[3]]=[float(i) for i in line[5:]]
  return geneDict

def Create_ELS_Dict(els, column):
  elsDictA={}
  elsDictB={}
  for line in els:
      line=line.rstrip().split("\t")
      if column == "no":
          score=max(float(i) for i in line[7:-1])
      else:
          score=float(line[column])
      if line[3] not in elsDictA:
          elsDictA[line[3]]=[float(line[-1]),score] # [size of overlap, counts fot the cell type considered]
          elsDictB[line[3]]=[float(i) for i in line[7:-1]] # [size of overlap, [counts for all cell types]]
      elif elsDictA[line[3]][0] < float(line[-1]):
      # See comment below first. Here, same kind of thing, but it is about maximizing the overlap.
      # Note that first the overlap is maximized, and only then the counts are maximized.
      # This has Shuge implications: if there are 1000 counts for a candidate enhancer with which the
      # overlap is 149, and at best 3 counts for enhancers with overlap 150, the ones with overlap 150 and 3
      # counts only are kept...
      # To prevent such a "side effect", one may replace the following "elif" with an "if"
                   # I personnaly think this side effect is undesirable, but here we keep the "elif"
                   # to obtain the same results as Moore et al.
          elsDictA[line[3]]=[float(line[-1]),score]
          elsDictB[line[3]]=[float(i) for i in line[7:-1]]
      elif elsDictA[line[3]][1] < score: # note that all peak widths are 150
      # if counts for another open chromatin region overlapping this enhancer has already been written,
      # but are fewer than for the current open chromatin region overlapping this same enhancer,
      # then we overwrite the counts with these new ones.
      # At the end of the day, this results in taking into account, for each enhancer, only the open chromatin
                # region that maximize the counts of DNase over a given enhancer ; although the selection is made among
                # regions that maximize the overlap only, see comment above.
          elsDictA[line[3]]=[float(line[-1]),score]
          elsDictB[line[3]]=[float(i) for i in line[7:-1]]

  # Well at the end of the day, elsDictB[key="enhancer id"] = [max overlap with a DHS, max counts in this DHS]
  return elsDictB, elsDictA

def Create_Symbol_Dict(symbols):
  symbolDict={}
  for line in symbols:
      line=line.rstrip().split("\t")
      symbolDict[line[0]]=line[1]
  return symbolDict

def Create_Stat_Dict(stats):
  # For now we know that:
  # stat (argv[4]) must contain at least 3 columns
  # first column is a gene id (see for loop at the end of the code)
  # 2nd and 3rd columns are float / real numbers.
  # Both are later compared to correlations.
  statDict={}
  for line in stats:
      line=line.rstrip().split("\t")
      statDict[line[0].rstrip()]=[float(line[1]),float(line[2])]
  return statDict

genes=open(sys.argv[1]) # gene expression
geneDict=Create_Gene_Dict(genes)
genes.close()
# geneDict[key = "gene NAME (not id)"] = [expression in cell line 1, expression in cell line 2, etc]

symbols=open(sys.argv[2]) # gene annotation
symbolDict=Create_Symbol_Dict(symbols)
symbols.close()

column=Process_Biosample(sys.argv[6]) # the correct column is 28 for GM12878

els=open(sys.argv[3]) # ccRE expression
elsDict, test =Create_ELS_Dict(els,column)
els.close()
# elsDict[key="enhancer id"] = [max overlap of this enhancer with a DHS, max counts for this max overlap]

# For now we try to rebuild statArray directly in this script.
#stat=open(sys.argv[4])
#statArray = Create_Stat_Dict(stat)
#stat.close()

# On essaye ci-dessous
# On le fait volontairement d'une maniere très peu optimisée, c'est juste pour tester, en évitant d'induire d'autres sources
# potentielles de problèmes

pairs=open(sys.argv[5]) # BENGI benchmark
all_cor = {}
for line in pairs:
  line=line.rstrip().split("\t")
  els=line[0] # candidate enhancer id
  gene=symbolDict[line[1].rstrip()] # name (not id) of candidate paired gene
  if els in elsDict and gene in geneDict:
      if gene in all_cor:
          all_cor[gene].append(Calculate_Correlation(elsDict[els],geneDict[gene]))
      else:
          all_cor[gene] = [Calculate_Correlation(elsDict[els],geneDict[gene])]
pairs.close()
# Now for each gene name of gene id found in the benchmark pairs, all_cor[gene] should
# be the list of the correlations of its expression accross all cell lines, with
# the counts of DNase accross all cell lines, for enhancers it is paired with

pairs=open(sys.argv[5]) # BENGI benchmark
statArray = {}
for line in pairs: #inutile il suffit de boucler sur tous les genes trouves, une seule fois chacun, qu'on aurait du enregistrer precedemment deja
  line=line.rstrip().split("\t")
  els=line[0] # candidate enhancer id
  gene=symbolDict[line[1].rstrip()] # name (not id) of candidate paired gene
  if els in elsDict and gene in geneDict:
      if gene not in statArray:
          statArray[gene] = [np.mean(all_cor[gene]), np.std(all_cor[gene])]
pairs.close()

pairs=open(sys.argv[5]) # BENGI benchmark

for line in pairs:
  line=line.rstrip().split("\t")
  els=line[0] # candidate enhancer
  gene=symbolDict[line[1].rstrip()] # name (not id) of candidate paired gene
  if els in elsDict and gene in geneDict:
      cor=Calculate_Correlation(elsDict[els],geneDict[gene]) # correlation between counts of DNase over els and gene expression accross the 112 biosamples

      # cor est la corrélation entre les counts max de DNase sur els, et l'expression du gène appairé avec cet els.

      # On a dit que :
      # statArray devait être issu d'un fichier de trois colonnes qui est tel que :
      # La clef est un id de gene (visiblement plutôt un NOM de gène ! - pourquoi pas...)
      # La première valeur est, pour chaque gène, la corrélation moyenne qu'on trouve entre ce gène et les ccRE auxquels il est appairé
      # La deuxième valeur est, pour chaque gène, l'écart-type de ces mêmes corrélations.

      if math.isnan(cor):
          cor=0
      if statArray[gene][1] != 0:
          Z=(cor-statArray[gene][0])/statArray[gene][1]
      else:
          Z=0
      p=stats.norm.sf(abs(Z))*2
      print line[2], "\t", cor, "\t", p, "\t", Z, "\t", els, "\t", line[1]

  else:
      pass
      print line[2], "\t", -100, "\t", 1, "\t", -100, "\t", els, "\t", line[1]
Running the code for BENGI benchmarks over GM12878
If working on Genotoul, start with:
conda activate base && conda activate abcmodel && conda activate py2 && module load bioinfo/bedtools-2.27.1
and before launching the script, do not forget (a lot of memory is required):
srun --mem=32G --pty bash
Now it suffices to run Run-Sheffield.sh over the six benchmarks:
./local_Scripts/Unsupervised-Methods/Run-Sheffield.sh GM12878.CHiC v3 Correlation-Methods/Sheffield
$ ./local_Scripts/Unsupervised-Methods/Run-Sheffield.sh GM12878.CHiC v3 Correlation-Methods/Sheffield
GM12878
Finding ccRE-dELS in input data...
Building enhancer matrix (DNase counts for all the input cell types) using bedtools... This can take several minutes...
Finding all genes in input...
Computing gene list (<id> <name>)...
Running python script... This can take several minutes...
./local_Scripts/Unsupervised-Methods/Run-Sheffield.sh GM12878.GEUVADIS v3 Correlation-Methods/Sheffield
etc.
Resulting in the following:
Correlation-Methods/
└── Sheffield
    ├── GM12878.CHiC
    │   ├── els.bed
    │   ├── enhancer-matrix.txt
    │   ├── genes
    │   └── genesFull
    ├── GM12878.CTCF-ChIAPET
    │   ├── els.bed
    │   ├── enhancer-matrix.txt
    │   ├── genes
    │   └── genesFull
   ... # same for the 4 others benchmarks
    ├── Results
    │   ├── GM12878.CHiC-Correlation.v3.txt
    │   ├── GM12878.CTCF-ChIAPET-Correlation.v3.txt
    │   ├── GM12878.GEUVADIS-Correlation.v3.txt
    │   ├── GM12878.GTEx-Correlation.v3.txt
    │   ├── GM12878.HiC-Correlation.v3.txt
    │   └── GM12878.RNAPII-ChIAPET-Correlation.v3.txt
    └── Signal-Matrices
        ├── dhs112_v3_int.bed
        ├── dhs112_v3_int.bed.gz
        ├── dhs112_v3_int_tab.bed
        ├── exp112.bed
        └── exp112_tab.bed
Analysis with R
Code
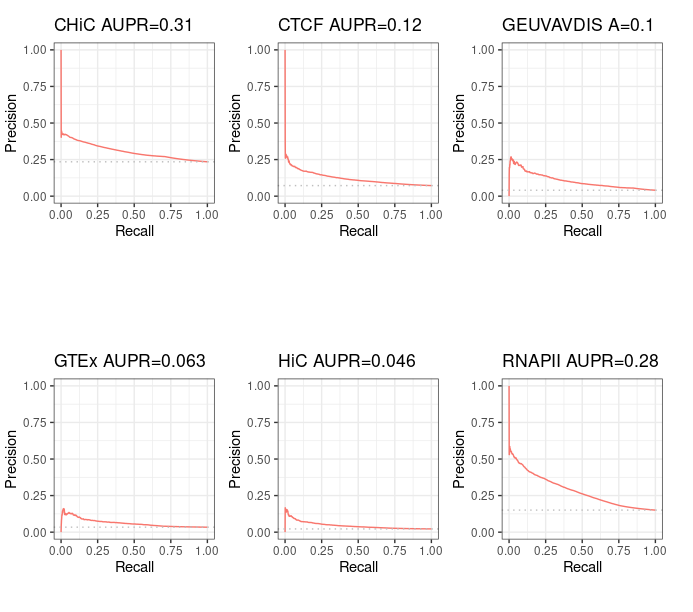
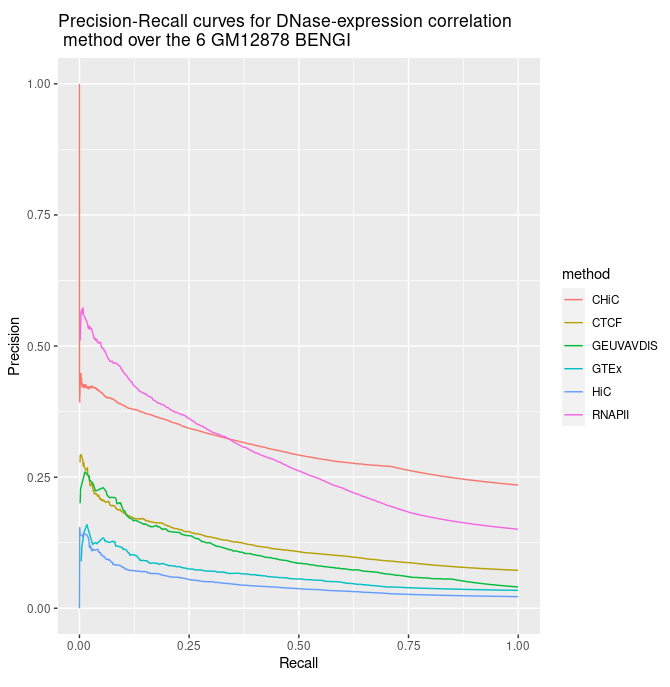
---
title: "BENGI Rank Distance evaluation"
date : "décembre 2020"
output:
  md_document
  #html_document:
    #toc: true
    #toc_float: true
    #toc_depth : 4
    #number_sections : true
---

```{css,echo=F}
.badCode {
background-color: #C9DDE4;
}
```

```{r setup, echo=FALSE, cache=FALSE}
library(knitr)
## Global options
options(max.print="75")
opts_chunk$set(echo=TRUE,
               cache=FALSE,
               prompt=FALSE,
               tidy=TRUE,
               comment=NA,
               message=FALSE,
               warning=FALSE,
               class.source="badCode")
opts_knit$set(width=75)
```

```{r}
library(ggplot2)
library(ggpubr) # for ggarrange
library(dplyr) # for bind_rows

# Tools for precision-recall : (see https://classeval.wordpress.com/tools-for-roc-and-precision-recall/)
library(precrec)
#library(ROCR)
#library(pROC)
#library(PRROC)
```

```{r, results="hide"}
rm(list = ls())

# Personal
work_dir = "~/Documents/INSERM/"
# Inserm
#work_dir = "~/Documents/"

path_to_results = paste(work_dir, "BENGI/Correlation-Methods/Sheffield/Results/", sep='')
#file_names = c("GM12878.CHiC-Correlation.v3.txt")
file_names = c("GM12878.CHiC-Correlation.v3.txt", "GM12878.CTCF-ChIAPET-Correlation.v3.txt", "GM12878.GEUVADIS-Correlation.v3.txt", "GM12878.GTEx-Correlation.v3.txt", "GM12878.HiC-Correlation.v3.txt", "GM12878.RNAPII-ChIAPET-Correlation.v3.txt")
#short_names = c('CHiC')
short_names = c('CHiC', 'CTCF', 'GEUVAVDIS', 'GTEx', 'HiC', 'RNAPII')

nb_files = length(file_names)

colnames <- c('interaction', 'cor', 'p', 'Z', 'ccRE', 'gene')
results <- sapply(file_names, simplify=FALSE, function(file_name){
  Df <- read.table(paste(path_to_results, as.character(file_name), sep=''), sep='\t')
  Df[[1]] <- factor(Df[[1]], levels=c(0,1), labels=c("no interaction", "interaction"))
  names(Df) <- colnames
  return(Df)
})
names(results) <- short_names

#library(dplyr)
All_results <- bind_rows(results, .id = 'method') # requires library(dplyr)
```

```{r}
str(results)
summary(results$CHiC)
```

```{r}
ggplot(aes(y = cor, x = method, fill = interaction), data = All_results) + geom_boxplot()
```


```{r}
sscurves_dnase_expression <- list()
sscurves_dnase_expression <- sapply(results, simplify=FALSE, function(Df){
  evalmod(scores = Df$cor, labels = Df$interaction) # comes with "precrec" library
})
```

```{r}
#library(ggplot2)
p1 <- autoplot(sscurves_dnase_expression[[1]], curvetype = c("PRC")) + ggtitle(paste(short_names[1], signif(attr(sscurves_dnase_expression[[1]], 'auc')[[4]][2], digits=2), sep = " AUPR="))
p2 <- autoplot(sscurves_dnase_expression[[2]], curvetype = c("PRC")) + ggtitle(paste(short_names[2], signif(attr(sscurves_dnase_expression[[2]], 'auc')[[4]][2], digits=2), sep = " AUPR="))
p3 <- autoplot(sscurves_dnase_expression[[3]], curvetype = c("PRC")) + ggtitle(paste(short_names[3], signif(attr(sscurves_dnase_expression[[3]], 'auc')[[4]][2], digits=2), sep = " A="))
p4 <- autoplot(sscurves_dnase_expression[[4]], curvetype = c("PRC")) + ggtitle(paste(short_names[4], signif(attr(sscurves_dnase_expression[[4]], 'auc')[[4]][2], digits=2), sep = " AUPR="))
p5 <- autoplot(sscurves_dnase_expression[[5]], curvetype = c("PRC")) + ggtitle(paste(short_names[5], signif(attr(sscurves_dnase_expression[[5]], 'auc')[[4]][2], digits=2), sep = " AUPR="))
p6 <- autoplot(sscurves_dnase_expression[[6]], curvetype = c("PRC")) + ggtitle(paste(short_names[6], signif(attr(sscurves_dnase_expression[[6]], 'auc')[[4]][2], digits=2), sep = " AUPR="))

# ggarrange comes with library('ggpubr')
figure <- ggarrange(p1, p2, p3, p4, p5, p6,
                    ncol = 3, nrow = 2)
figure
```


Alternatively we can plots all Precision - Recall curves on the same graph.

```{r}
all_sscurves_dnase_expression <- sapply(sscurves_dnase_expression, simplify = FALSE, function(obj){
  Df <- data.frame(obj$prcs[[1]]$x, obj$prcs[[1]]$y)
  names(Df) <- c('x', 'y')
  return(Df)
})
all_sscurves_dnase_expression <- bind_rows(all_sscurves_dnase_expression, .id = 'method')

total_nrow = nrow(all_sscurves_dnase_expression)
max_nb_points_to_plot = 20000
if(total_nrow>max_nb_points_to_plot){
  set.seed(1)
  samples_points = sample(1:total_nrow, min(max_nb_points_to_plot, total_nrow), replace=TRUE)
} else{
  samples_points = 1:total_nrow
}


ggplot(aes(y = y, x = x, color = method), data = all_sscurves_dnase_expression[samples_points,]) + geom_line() + ylim(0,1) + xlab('Recall') + ylab('Precision') + ggtitle("Precision-Recall curves for DNase-expression correlation\n method over the 6 GM12878 BENGI")
```
Results